
Last Updated on March 18, 2025 by Neil Murray
Table of Contents #
CF7 Skins #
CF7 Skins Tools #
CF7 Skins Visual Tools #
- Glossary
- Components, Hooks, Functions, Variables etc.
- CF7 Skins Field Rules
- CF7 Skins Ready Rules
- CF7 Tags
- CF7 Skins Visual – Folders & Files
- Visual User Interface Versions
CF7 Skins Visual JavaScript interface #

Chrome Dev Tools #
- Google Chrome Developer Tools Crash Course (Video)
- Chrome DevTools Masterclass (Video)
- Mastering Chrome Developer Tools with Jon Kuperman (Video)
- 30 Chrome DevTools Tips (Video)
React Developer Tools #
Debugging #
Refer:
Xdebug #
- Learn Xdebug
- Using Xdebug within Local
- WordPress Xdebug Setup for Local with VSCode
- How to Set Up PHP Debugging Using Xdebug and VSCode
- Debug and profile your WordPress sites with Xdebug in Local by Flywheel
- LocalByFlywheel + XDebug + VSCode
Debugging in WordPress #
It’s well worth ensuring that the following directives are in your development site’s wp-config.php file:
define( 'WP_DEBUG', true );
define( 'WP_DEBUG_LOG', true );
define( 'WP_DEBUG_DISPLAY', false );
define( 'SCRIPT_DEBUG', true );
The last line, i.e. define( 'SCRIPT_DEBUG', true ); forces the use of development versions of JavaScript files, rather than minified versions, thereby making debugging easier.
If at any point your block isn’t working and you can’t find any other good reason it may be that the JavaScript files are simply not being fetched by the browser. Remember that you can use the ‘Sources’ tab in the browser’s devtools to check that the JavaScript is being loaded.
[ADD image]
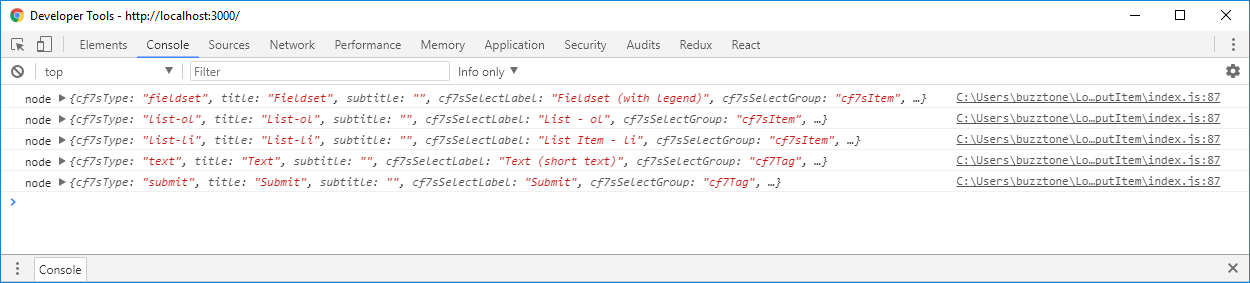
And one final tip – if you want to go deep on the state of your application you can type wp in the browser’s console. This is the global const that you can use to examine the data store. You’ll see something like this:

To maximise your chances of getting a useful response you should formulate your question clearly and provide as much detail as possible. Follow the advice in this guide when posting your question to one of the above resources.
Refer:
- Advanced WordPress Debugging – COURSE
- Understanding how WordPress Hooks work from a Stack Trace
- How to Ask Good Technical Questions – the Ultimate Guide
Errors in the Block editor #
As you’ve already seen as you worked through this course, often when you’ve edited some code, especially if you’ve made changes to the save() function in save.js, the block rendered by the new version of the code might not match the version saved in the database and you’ll see this error:
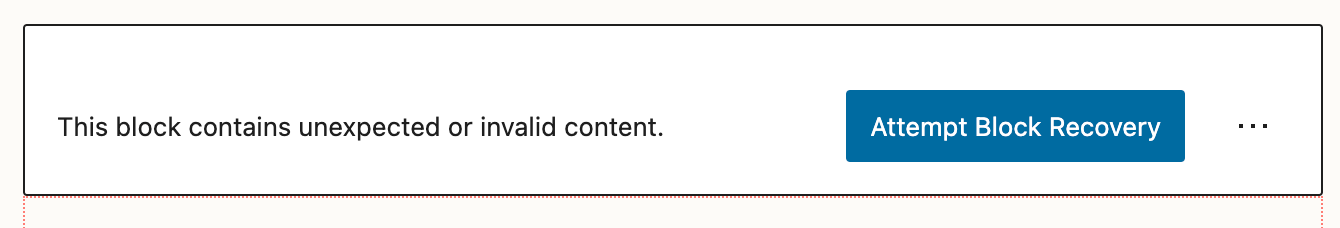
There’s a button with which you can attempt block recovery. This will usually work as in this type of error Gutenberg is itself catching the errors and so they are usually recoverable. The three dots to the right of the error give you more options that may also help you to resolve the problem:

Remember that you can also inspect the difference between the two versions, i.e. the newly rendered version and the saved version, in the browser console if necessary.
You may occasionally also see this error in the editor:

This is a more critical editor-based error and Gutenberg cannot recover from it by itself. In this case you will need to inspect the error in the browser console to find out what’s gone wrong.
[ADD image]
This is usually a sign of an error in the JavaScript code. You’ll usually see this when the compiler has passed and built the code but there’s a JavaScript runtime error. This error can occur because of a problem in either a JavaScript (.js) or a JSON (.json) file.
[ADD image]
If, when editing your files, you find that updates are not appearing in the editor check that the start script is still running. If your terminal window is hidden behind other windows the script might have stopped without you realising.
Code Editor #
You can use your code editor to find the code where particular functionality is added.
Use your text editor to scan part of the text. You can see where it is added in the files.
For example we want to adjust something related with “GRID” section.
Use the browser Developer Tool to inspect the element.
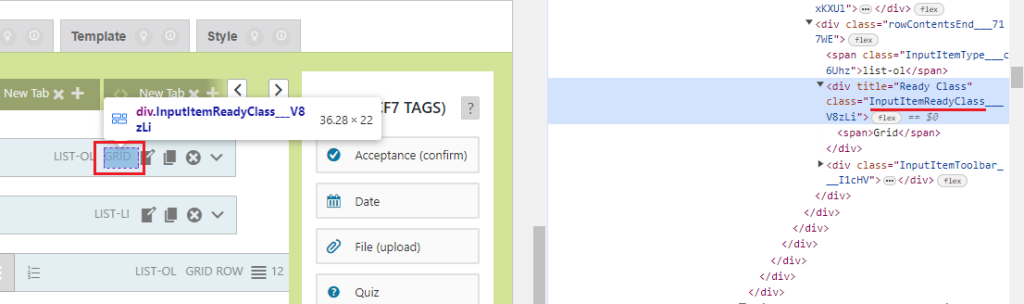
Disregard the “___V8zLi” because it is generated by CSS modules.
Simply use “InputItemReadyClass”.
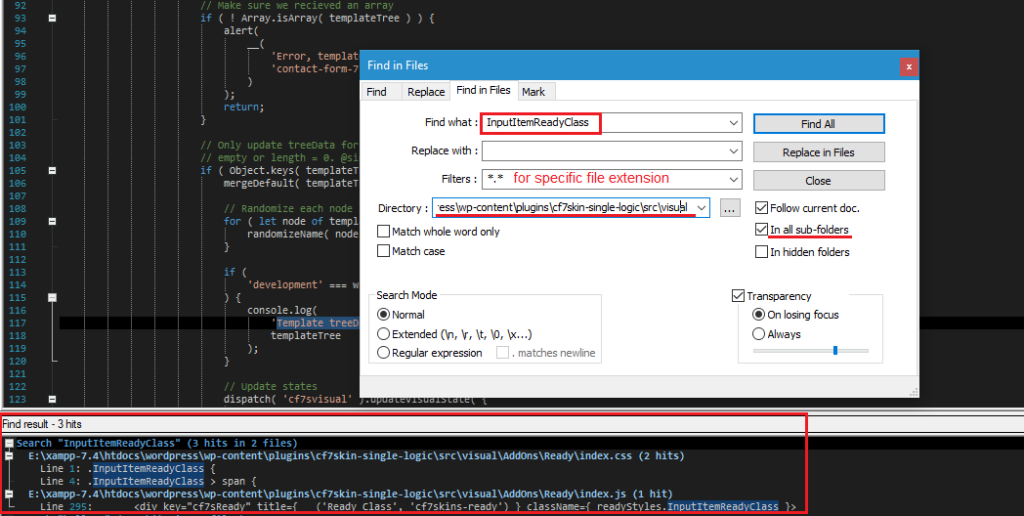
We know it is filed in /src/visual, and using Notepad++, search the string “Find in Files” in the directory.
Visual Studio Code
- Visual Studio Code Intro & Setup (Video)
- Visual Studio Code – Debugging
- Set Up Visual Studio Code and xDebug as the Ultimate Editor for WordPress Development
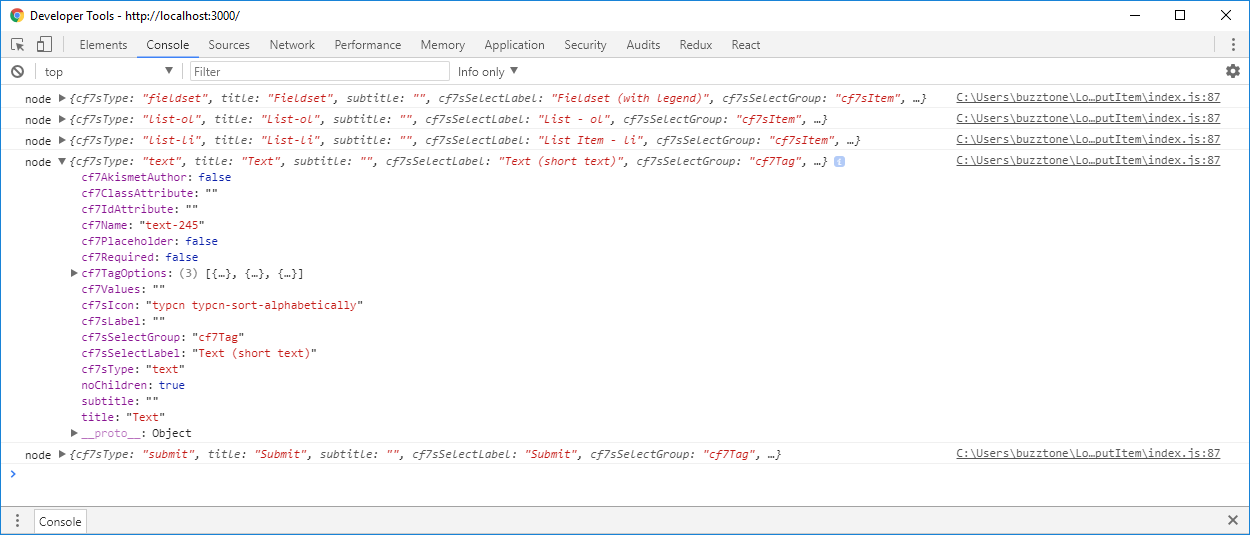
Console #
You can use any of the console methods anywhere in your code to generate informative messages in the browser’s console about the state of the application.
There are a number of useful console methods but console.log() is the most commonly used one, however the lesser known console.table() is useful for examining the properties of an object. In block development you’re often working with objects, such as the attributes object, so console.table() is a method worth having in your debugging armoury.
Refer: mdn web docs – console
Git #
SourceTree – Git GUI application
SourceTree Knowledge Base
Tutorial: Learn SourceTree with Bitbucket Cloud
How To Use GIT and SourceTree – For Beginners